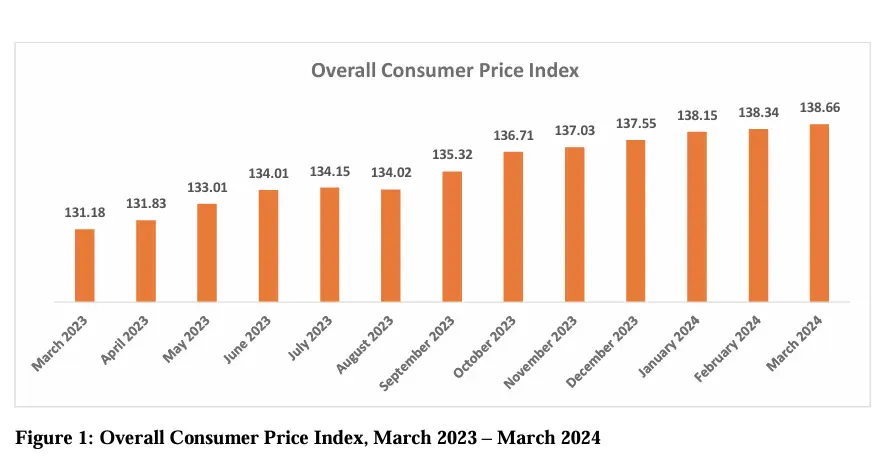
The Consumer Price Index (CPI) in Kenya is a measure that examines the weighted average of prices of a basket of consumer goods and services, such as transportation, food, and medical care.
It is one of the most widely used measures of inflation.
It is calculated by taking price changes for each item in the predetermined basket of goods and averaging them. Changes in the CPI are used to assess price changes associated with the cost of living.
The CPI is a statistical estimate constructed using the prices of a sample of representative items whose prices are collected periodically.
The CPI is calculated by national statistical agencies using a weighted average of prices for various categories of consumer expenditures. The index is updated regularly to reflect changes in consumer spending habits.
In Kenya, the Kenya National Bureau of Statistics is responsible for compiling and publishing the CPI data, which is a critical indicator for determining the inflation rate in the country.

In summary, the CPI is an essential economic indicator that measures changes in consumer prices over time to assess the rate of inflation and its impact on purchasing power
The CPI is used to adjust wages, salaries, and pensions, regulate prices, and show changes in real values.
The CPI is also essential in recognizing periods of inflation and deflation, although it may not always accurately reflect these due to volatile food and oil prices.
It’s important to note that the Consumer Price Index is a statistical estimate vulnerable to sampling errors and is not applicable to all consumers for determining relative living costs.
Summary: the Consumer Price Index is a vital tool for monitoring inflation, adjusting financial values, and understanding changes in consumer purchasing power over time.
CPI Kenya Rates table, 2024
| Month | Overall CPI | Inflation Raye |
|---|---|---|
| March 2023 | 131.18 | 9.2 |
| April 2023 | 131.83 | 7.9 |
| May 2023 | 133.01 | 8.0 |
| June 2023 | 134.01 | 7.9 |
| July 2023 | 134.15 | 7.3 |
| August 2023 | 134.02 | 6.7 |
| September 2023 | 135.32 | 6.8 |
| October 2023 | 136.71 | 6.9 |
| November 2023 | 137.03 | 6.8 |
| December 2023 | 137.55 | 6.6 |
| January 2024 | 138.15 | 6.9 |
| February 2024 | 138.34 | 6.3 |
| March 2024 | 138.66 | 5.7 |
Understanding CPI terms and figures
Understanding Consumer Price Index (CPI) figures involves knowing that the CPI represents the average change over time in the prices paid by urban consumers for a market basket of consumer goods and services.
Here’s a breakdown of how to understand CPI figures:
- Market Basket: The CPI uses a “basket” of goods and services, which includes hundreds of items commonly used by consumers, such as food, clothing, shelter, fuels, transportation fares, charges for doctors’ and dentists’ services, and drugs.
- Base Year: The CPI measures the price change relative to a base year. The base year serves as the benchmark to which future prices are compared.
- Price Changes: To calculate the CPI, the prices of the individual items in the predetermined basket are collected and compared to the prices of those items in the base year.
- Weighting: Each item in the basket has a weight assigned to it. This weight is proportional to the share of expenditure the average consumer spends on that item. Items that consumers spend more money on are given a higher weight in the CPI calculation.
- CPI Value: The CPI value is usually expressed as an index number, starting from the base year which is typically set to 100. For instance, a CPI reading of 138.66 means that there has been a 38.66% increase in the level of prices since the base year.
- Inflation and Deflation: If the CPI is rising, the period is generally considered inflationary, meaning that prices for consumer goods and services are increasing. Conversely, if the CPI is falling, it can be an indication of deflation, where prices are decreasing.
- Monthly and Annual Changes: CPI figures are often reported on a monthly and annual basis. Monthly changes provide a sense of the short-term trend in price levels, while annual changes are used to assess longer-term trends in inflation.
- Core CPI: Sometimes, analysts look at the “core CPI,” which excludes food and energy prices because they can be very volatile. By excluding these items, the core CPI can provide a clearer picture of the underlying inflation trend.
To apply this understanding, when you see a CPI figure reported, you can interpret it as a measure of inflation from the perspective of the consumer.
If the CPI is increasing, it generally means that the cost of living is rising as consumers are paying more for the same basket of goods and services.